Configured, not coded
The person who maintains it in three years is not the person who built it
That is the real test of plant-floor software, and custom code fails it every time.
Everything in Event Engine® is built, changed and monitored through the browser interface: processors, tags, structures, triggers and events. No programming, no scripting language to learn, no compiled assembly that only its author understands, and no source file living on somebody's laptop.
The consequence is the one that matters at two in the morning. A change is a form, not a deployment. The engineer who did not build the system can still read it, because what is on the screen is the configuration itself rather than a representation of code somewhere else.
- Changes go in live. Add and edit events without restarting the service or disturbing the rest of the operations.
- Access is controlled by role. Mapped to Windows or Active Directory groups — a general role that views and operates, an admin role that configures.
- Nothing to install to use it. Any browser on the plant network. No engineering workstation client, no VPN session to look at an event.
- The configuration is portable. Export items as JSON, back the whole thing up as a ZIP, restore it onto a new host.
- It reads in three languages. English, Spanish (es-MX) and German (de-DE), remembered per Windows user.
A change is a form, not a deployment.
Diagnostics
When it fails at 2 a.m., find out why at 2:01
The hard part of a middleware fault has never been fixing it. It is finding out what happened, hours later, from a system that recorded only that things finished.
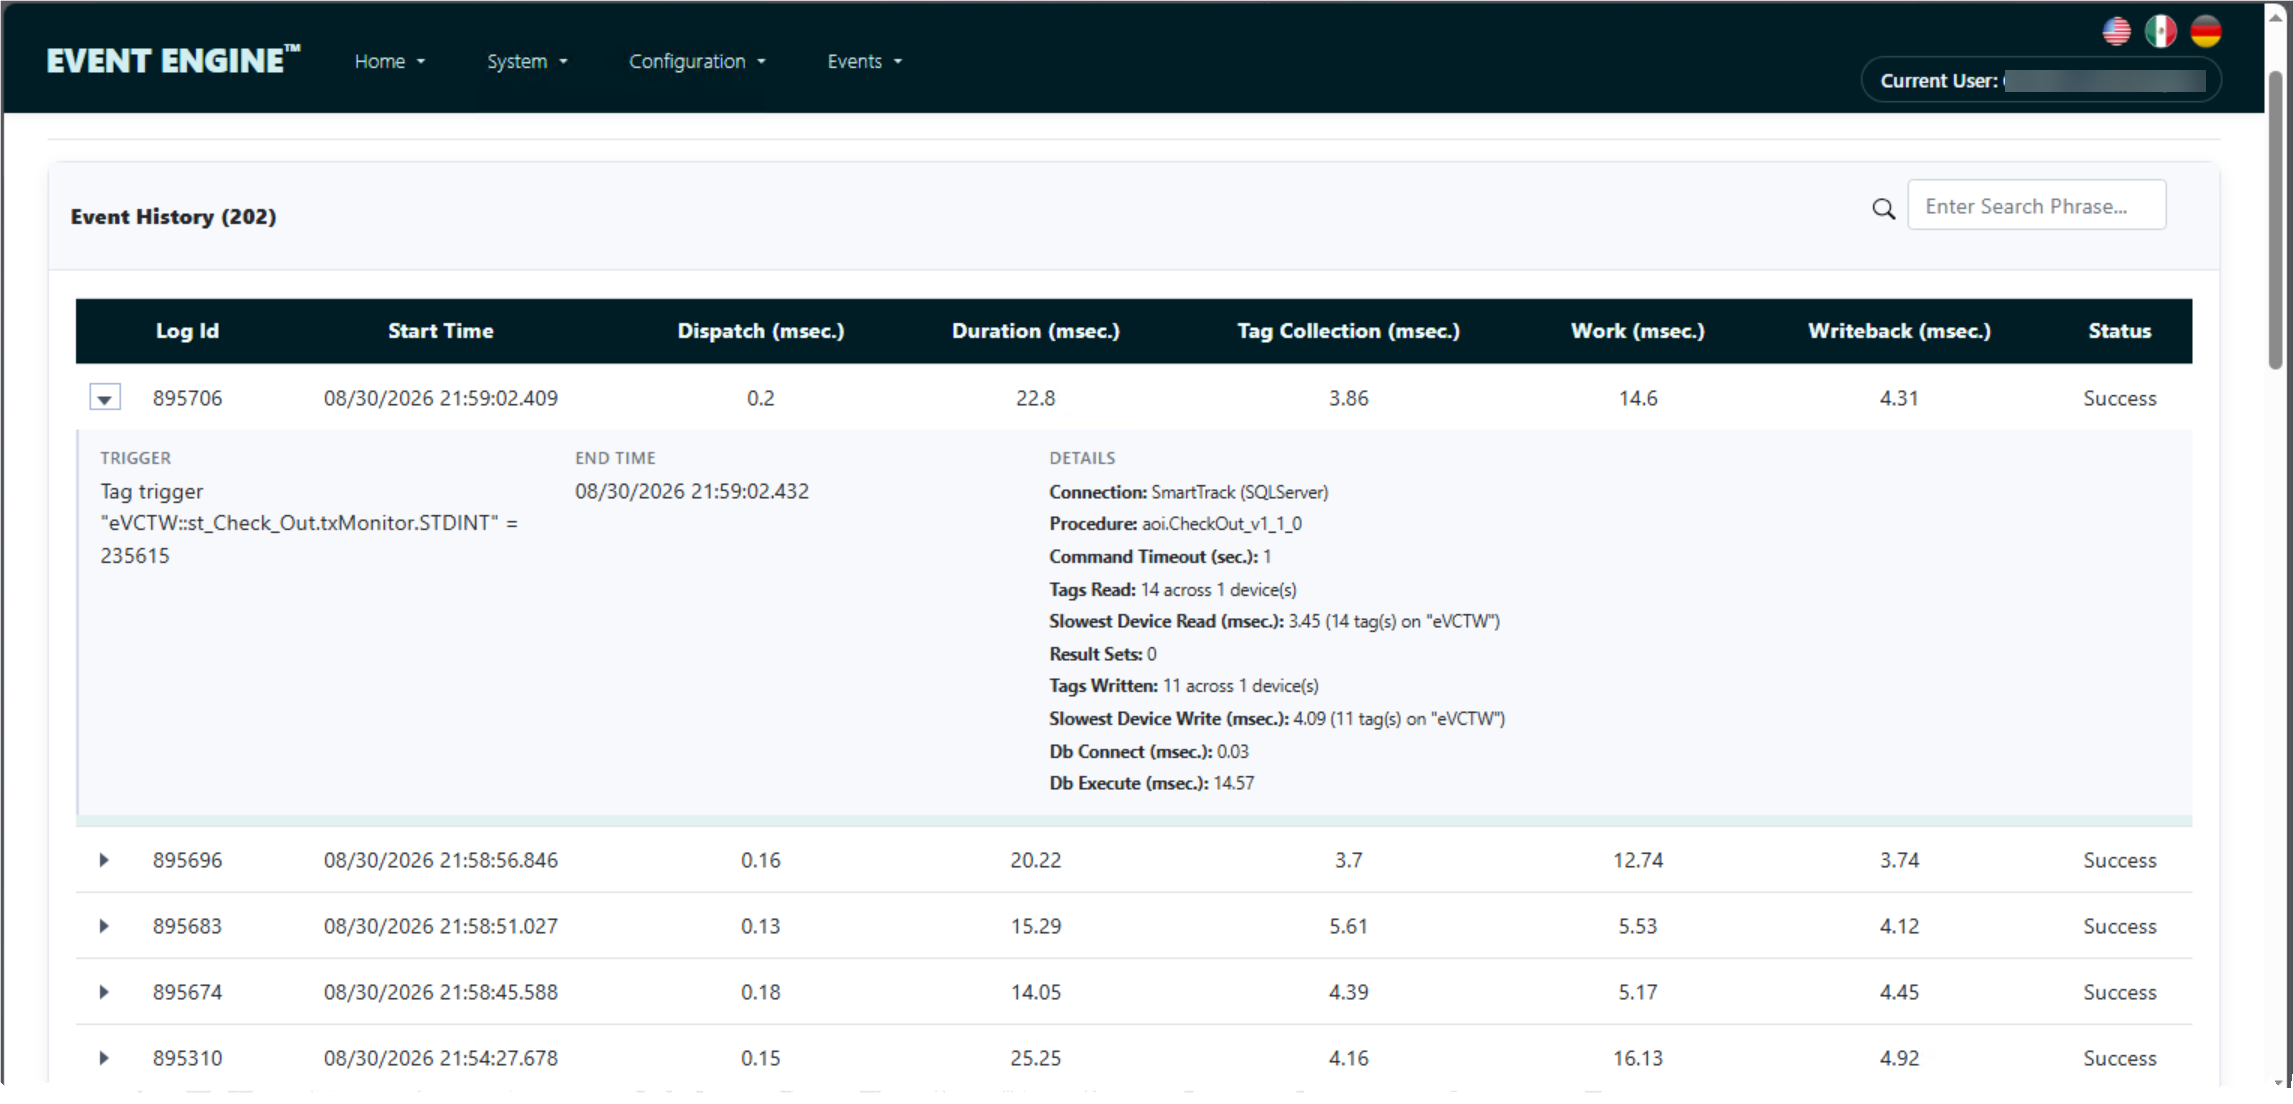
Event Engine® records what was attempted, what the controller returned, what the database returned, and where in the sequence it stopped — per event, with status, timing and search. Nothing has to be reproduced in order to be studied, which matters because the conditions that produced it are usually gone.
Three phases, timed separately
Every execution is broken into the parts that can actually be slow, and each is measured on its own: tag collection — reading the controller; work — the database call, the print job, the message; and write-back — returning results and the completion code to the PLC.
This is the difference between "the data collection is slow" and knowing which of the middleware, the database or the network is responsible. Event Engine® will not fix a database that is genuinely the problem — but it will stop the argument about whose problem it is, in the first minute rather than the second week.
Alongside it: a system dashboard with run state, total event calls, events and errors in the last hour, and a rolling error list; per-event success rate with minimum, maximum, last and average durations; and manual trigger and counter reset for commissioning. Statistics, status and errors stream to the open page as they happen — no refreshing to see whether something changed.
Event Health
The warning arrives before the failure does
Diagnostics answer what happened. Event Health answers a different question: has anything changed about the way your events are running?
An event whose stored procedure has slowed from 40 milliseconds to 900 over three weeks is still succeeding. It appears on no error list and in no log, because nothing went wrong — right up to the day it crosses its command timeout and stops the line. Event Health watches for exactly that, and tells you while there is still time to act.
Every execution is sampled: tag collection, database connect, database execute, write-back, dispatch and total duration. Each sample is judged against a rolling baseline built from that event's own history rather than a global threshold someone guessed at — so an event that normally completes in 40 milliseconds and one that normally takes three seconds are each measured against themselves.
Timeout headroom is the signal that matters
The measure that predicts that failure is how much of its configured command timeout an event spends on database work, at the 95th percentile. That is the margin between working and faulting.
An event that has quietly gone from using 22% of its timeout to 61% has not failed yet. But it will, on the first shift busy enough to close the gap — and that is the shift where parts get scrapped with no assignable cause.
You get the warning weeks before the surge that would have used it up.
What it watches for
- Timeout headroom — “Uses 61% of its command timeout, against a baseline of 22%.”
- Step change — a median that jumped rather than crept: “Db execute median rose from 45 ms to 310 ms.”
- Drift — “Duration is climbing steadily across the recorded history.”
- Failure rate — the share of recent runs failing, measured against that event's own baseline rather than an absolute number
- Chronic failure — “Has failed 14 of its last 200 executions.” The one that finds an event that has been failing since the day it was configured: it never got worse, so no comparison would ever have mentioned it
- Write-back divergence — runs that succeeded but could not write completion back to the controller. Silent by nature: the database has the record and the PLC does not know it landed
- Contention bursts — clusters of lock timeouts, command timeouts, connection-pool exhaustion, or connection failures
Judged in executions, not in hours
Recent behaviour is compared against earlier behaviour using windows counted in executions — the last 200 runs against the 2,000 before them. Production schedules change, shifts get added and dropped, product mix varies; a window measured in time would report a quiet shift as an improvement and a busy one as a regression. The baseline also stops where the recent window starts, so a slow drift can never drag its own reference along behind it.
Every central figure is a median rather than an average, because one run that waited 26 seconds on a lock moves an average substantially and a median not at all. An average has you chasing a single bad night.
Nominal, Watch, Degrading, Critical
Every event carries a state, and the health page filters straight to the ones that need attention. Until an event has enough history to judge honestly it reads No baseline rather than reporting itself healthy — the system doesn't raise findings it can't support, and it doesn't reassure you on the strength of thirty samples. Findings are deliberately slow to appear and slow to clear: one must hold for two consecutive checks before it opens, and clear for two before it resolves, so nothing near a threshold flips state every few minutes.
Notification is off, immediate, or a digest on an interval you choose, with recipients assigned per event — so the engineer who owns a line hears about that line, and nobody learns to ignore the mail.
It costs the event nothing
The observer sits on no part of the event path. It reads the telemetry files the system already writes, after the fact, so it cannot slow an event down no matter what it finds or how much history it is working through. It survives restarts, it keeps far more history than anything reading memory could, and on first run it reads back through the history you already have. There is nothing to configure — it is on, and it needs no thresholds set.
Throughput
Built for the peaks, not the average
Events don’t arrive at a steady rate. They arrive the way production does — in bursts.
A cell finishes its cycle, a pallet indexes, a batch completes, an operator clears a fault and the queue behind it releases all at once. The average tells you almost nothing: a line averaging five events a second can swing between none and thirty-five concurrent, and it is the thirty-five that decides whether you scrap parts. Size for the average and you have guaranteed a failure at the peak.
Most middleware is sized for the average, because it treats database connections as disposable — opened, used, dropped, re-authenticated. Under normal load nobody notices the cost. When twenty events fire at once, reconnection overhead stacks up behind them and the PLC’s timeout window closes first. The event faults. The part gets scrapped. And nothing kept a record of why.
Event Engine® holds warm connections ready and manages the concurrency itself, so a burst runs at the speed of your database rather than the speed of a login. The peak is absorbed rather than queued through — and the quiet stretch between peaks costs nothing to stay ready for.
Proof
An hour of lost production a day, recovered
An automotive components manufacturer averaged five events per second — but the process swung between none and thirty-five concurrent.
The peaks were enough to fault events with no assignable cause: dropped records, scrapped parts, missed cycles, and roughly an hour of lost production every day. Months of troubleshooting found nothing — not because nobody looked, but because nothing in the stack had recorded anything to find. The faults happened during the surge and the surge was over by the time anyone opened a log.
Switching to Event Engine® eliminated the issue by absorbing the bursts that had been paralysing their system. It also let them consolidate several separate middleware instances onto a single Event Engine® instance — which still used a fraction of the system resources required by any one instance of the platform it replaced.
- Before
- Faulted events with no assignable cause; roughly one hour of lost production per day.
- After
- Bursts handled without fault; multiple middleware instances consolidated onto one.
- Load
- 5 events per second average, swinging between 0 and 35 concurrent.
Run it beside what you have
Thirty days, fully functional. Point it at one line, let it build a baseline, and see what it says about events you were told were fine.
Reliability
No hidden queue
Store-and-forward solves two different problems, and conflates them.
Load spikes that outrun the system, and outages that take it away entirely. The spikes are by far the common case — and Event Engine® solves those at the source rather than queueing through them. Buffering manages the symptom; warm connections and modern algorithms remove the cause.
A queued record is a promise, not a record
Buffering is a historian pattern. A historian collects values for later analysis — nobody is waiting on them, so backfilling an hour of data an hour late costs nothing. A transactional record is different. A quality result, a genealogy record, a serial number assignment participates in the process; something downstream is waiting to act on it.
So production keeps running, and the truth about a part lives somewhere else — in a queue, on another machine, under a clock nobody reconciles. Downstream logic has to keep processing, so the equipment marks the part good on its own assessment, with no database record behind it. The next station then treats what arrives as good, on the assumption it would have been rejected otherwise. Two problems, not one: the assumption of good product, and the inability to verify it afterward. Closed-loop control is a further casualty — a setpoint derived from an upstream measurement cannot be derived from a measurement that is still in a queue.
A window is not a containment
Vendors will tell you they log when the outage started and ended, so at least you know the window. That doesn't tell you which parts were built inside it, which were cleared against records that weren't there, or where those parts are now. Someone still walks it back by hand, under pressure — which is exactly the work traceability was bought to eliminate.
The premise has moved
Store-and-forward was designed when middleware ran on an industrial PC in a control cabinet at the end of a fragile plant network. Your database now runs on a managed server in a data center, with failover and an uptime target in writing. If it genuinely isn't reliable, that is the thing to fix — buffering only makes the unreliability harder to see.
The machine never runs on the assumption that a record landed.
Event Engine® works in real time. Every event is acknowledged back to the controller — completed or failed, with a status code and a timestamp. If the database can't be reached, the PLC knows immediately, and your logic decides what happens next: retry, alarm, hold the line, or divert the part.
Operations
What you are actually agreeing to run
- On the host
- One Windows service that hosts its own web interface. No separate web server, no SCADA platform underneath it, no OPC server unless a controller needs one.
- Where it runs
- Windows Server or Windows 10/11, on-premises or in your own cloud. No vendor cloud service, and no outbound dependency for it to keep working.
- Backup
- Configuration is JSON files on disk. Back up the data folder, or export the whole configuration as a ZIP and restore it onto another host.
- Access
- Role-based, mapped to your existing Windows or Active Directory groups. Nothing new to administer.
- Monitoring
- Event Health is on after install and needs nothing configured. Findings can email a digest, or the critical ones immediately.
- Support
- Perpetual or subscription licensing, with an annual maintenance agreement available on perpetual licences.
Downloads
Read it before you run it
The installer, and the documentation that says what every option does to a running system — including the licence and maintenance terms, up front.
- Event Engine® — 30-day trial — fully functional, no credit card, no sales call
- Event Engine® Overview (PDF) — the short version, for circulating
- Event Engine® User’s Guide (PDF) — every screen, and what each option does to the running system
- Event Engine® EULA (PDF) — the licence terms, before you have to ask for them
- Annual Maintenance Agreement (PDF) — support and upgrade coverage
Requires Windows, SQL Server or Oracle, and a PLC or OPC server.
Also worth reading
Before it is yours to run, somebody builds it
If an integrator is standing this up for you, the configuration page is the one that tells you what they are quoting — and what it will cost to change later.